
This is an old revision of the document!
Table of Contents
Monitoring UPS with Grafana
Objective: This project aims to monitor the status of a UPS (Uninterruptible Power Supply) by fetching data through a web service and storing it in a MariaDB database. The data is then visualized in a Grafana dashboard.

😅 This image was created in May 2024, using Bing AI. Apparently it struggles a bit with the cable routing… ToDo: create this same prompt (raspberry pi connected to an UPS using a USB cable, photorealistic) in a couple of years.
Code
- main.py
import mariadb
import requests
import datetime
import re

# Función para insertar un valor en la base de datos
def insert_value(cursor, id_variable, value):
    timestamp = datetime.datetime.now().strftime('%Y-%m-%d %H:%M:%S')
    query = "INSERT INTO ups_data (id_variable, value, timestamp) VALUES (?, ?, ?)"
    values = (id_variable, value, timestamp)
    cursor.execute(query, values)
    print(f"Valor con id_variable {id_variable} insertado en la base de datos: {value}")

# Conexión a la base de datos MySQL
db = mariadb.connect(
    host="localhost",
    port=3306,
    user="f******",
    password="***my*assword***",
    database="UPSstats"
)

cursor = db.cursor()

# URL de la consulta HTTP
url = 'http://raspberry.facundoitest.space:5000/run_command/upsc'

# Hacer la solicitud HTTP
response = requests.get(url)

if response.status_code == 200:
    data = response.text

    # Definir las variables de interés y sus IDs
    variables = {
        'battery.charge': 1,
        'battery.runtime': 2,
        'input.voltage': 3,
        'output.frequency': 4,
        'output.voltage': 5,
        'ups.load': 6,
        'ups.status': 7
    }

    # Expresiones regulares para capturar los valores de interés
    regex_patterns = {
        'battery.charge': re.compile(r'battery\.charge:\s*(\d+)'),
        'battery.runtime': re.compile(r'battery\.runtime:\s*(\d+)'),
        'input.voltage': re.compile(r'input\.voltage:\s*(\d+\.?\d*)'),
        'output.frequency': re.compile(r'output\.frequency:\s*(\d+\.?\d*)'),
        'output.voltage': re.compile(r'output\.voltage:\s*(\d+\.?\d*)'),
        'ups.load': re.compile(r'ups\.load:\s*(\d+)'),
        'ups.status': re.compile(r'ups\.status:\s*(\w+)')
    }

    # Extraer y almacenar los valores de interés
    for var_name, var_id in variables.items():
        match = regex_patterns[var_name].search(data)
        if match:
            value = match.group(1)
            insert_value(cursor, var_id, value)

    # Confirmar los cambios
    db.commit()
else:
    print("Failed to fetch the UPS data")

# Cerrar la conexión
cursor.close()
db.close()
Code Explanation:
1. Database Insertion: The `insert_value` function inserts a value into the MariaDB database with the current timestamp. It uses a prepared statement to ensure the data is safely inserted.
2. Database Connection: The script connects to the MariaDB database hosted locally using specified credentials.
3. HTTP Request: The script sends a GET request to a URL hosted on a Raspberry Pi to fetch UPS data. The response is expected to be in plain text.
4. Regular Expressions: The script defines a set of regular expressions to extract specific variables from the UPS data returned by the HTTP request.
5. Data Extraction and Storage: The script iterates over the variables, applies the corresponding regex to extract the value, and inserts each value into the database.
6. Commit and Close: Changes are committed to the database, and the connection is closed.
Note: This script requires the following dependencies: mariadb, requests, datetime, re.
Database Creation
To create the database and the necessary tables for storing the UPS data in MariaDB, you would use the following SQL commands:
1. Create the Database:
CREATE DATABASE UPSstats;
2. Use the Database:
USE UPSstats;
3. Create the `variables` Table:
This table will store the variable names and their corresponding IDs.
CREATE TABLE VARIABLES (
    id_variable INT PRIMARY KEY,
    variable_name VARCHAR(255) NOT NULL
);
4. Insert the Variables:
Insert the variables you are interested in tracking into the `variables` table.
INSERT INTO VARIABLES (id_variable, variable_name) VALUES
(1, 'battery.charge'),
(2, 'battery.runtime'),
(3, 'input.voltage'),
(4, 'output.frequency'),
(5, 'output.voltage'),
(6, 'ups.load'),
(7, 'ups.status');
5. Create the `ups_data` Table:
This table will store the actual data readings from the UPS.
CREATE TABLE ups_data (
    id INT AUTO_INCREMENT PRIMARY KEY,
    id_variable INT,
    VALUE VARCHAR(255),
    TIMESTAMP DATETIME,
    FOREIGN KEY (id_variable) REFERENCES VARIABLES(id_variable)
);
With these commands, you will have a database named `UPSstats` with two tables: `variables` for storing the names and IDs of the variables, and `ups_data` for storing the actual readings along with their timestamps. Make sure to execute these commands in your MariaDB client to set up the database before running your Python script.
GRANT ALL PRIVILEGES ON UPSstats.* TO 'facundo'@'%' WITH GRANT OPTION;
FLUSH PRIVILEGES;
Flask Service
- flask_service.py
from flask import Flask
from subprocess import run, PIPE

app = Flask(__name__)

@app.route('/run_command/<command>')
def run_command(command):
    # Define the command to run based on the URL parameter
    if command == 'neofetch':
        cmd = ['neofetch']
    elif command == 'uptime':
        cmd = ['uptime']
    elif command == 'upsc':
        cmd = ['upsc', 'ups']
    else:
        return 'Invalid command'

    # Run the command and capture the output
    result = run(cmd, stdout=PIPE, stderr=PIPE, text=True)

    # Check if the command executed successfully
    if result.returncode == 0:
        # Wrap the output in <pre> tags to preserve formatting
        output = f'{result.stdout}'
        return output
    else:
        return f'Error running command: {result.stderr}'

if __name__ == '__main__':
    app.run(host='0.0.0.0', port=5000, debug=True)
Code Explanation:
1. Flask Setup: A Flask web application is set up to handle HTTP requests on port 5000.
2. Command Execution: Based on the command specified in the URL, the Flask app runs a predefined shell command (`neofetch`, `uptime`, or `upsc`) using the `subprocess` module.
3. Output Handling: The output of the command is captured and returned as the HTTP response. If the command fails, an error message is returned.
Note: This script requires the following dependencies: flask, subprocess.
Design notes:
In summary:
- Querying UPS status with 'upsc':
- Linux uses the 'upsc' command to query the status of the UPS (Uninterruptible Power Supply) via the NUT (Network UPS Tools) driver. In this case, a driver, probably 'usbhid', is used to communicate with the UPS.
- 'upsc' provides various data about the UPS, such as battery charge level, remaining battery runtime, input and output voltage, among others.
- Executing 'upsc ups' command with Python:
- In a Python script, the `subprocess` module is used to execute the 'upsc ups' command and capture the standard output (stdout). This allows integrating the UPS status query within the Python program's flow.
- Receiving HTTP requests with Flask:
- A Flask server runs on a Raspberry Pi, listening for HTTP requests on port 5000.
- When a request is received at the URI '/run_command/upsc', Flask executes the 'upsc ups' command using `subprocess` and returns the result in ASCII format.
- Querying UPS status from another server:
- From another server, a script performs the “heavier task”:
- It connects to the MariaDB database.
- Sends an HTTP request to the Raspberry Pi to execute 'upsc ups' and get the current UPS status.
- Receives the response and uses regular expressions (regex) to parse the output and extract the relevant values.
- Storing the data in MariaDB:
- The extracted data is inserted into the MariaDB database with a timestamp, assigning each value to its corresponding variable (e.g., 'battery.charge', 'input.voltage', etc.).
- This stored information is later used for visualizations and analysis in a Grafana dashboard.
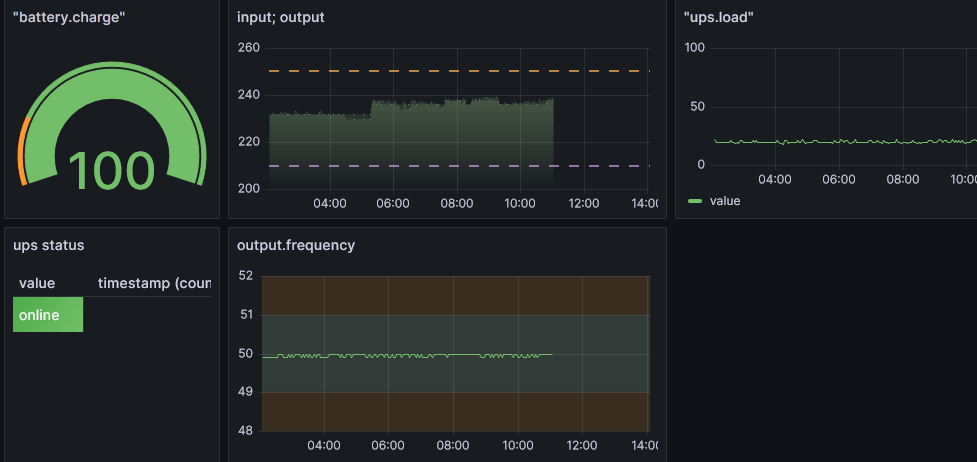
Results
The Grafana dashboard visualizes the UPS data in real-time, providing insights into various metrics like battery charge, input voltage, output frequency, and UPS status.
Live site: https://monitoring.facundoitest.space/public-dashboards/d26eff1b7dd548e6a5a88426efda10ba